plot(1:10)การควบคุม chunk
R
TL;DR
ตัวอย่าง สิ่งที่อยากควบคุม
- ซ่อนโค้ด echo=FALSE
- ซ่อนผลลัพธ์ results='hide'
- ไม่รันโค้ด eval=FALSE
- ซ่อนทุกอย่าง (แต่รันอยู่เบื้องหลัง) include=FALSE
- ซ่อนข้อความเตือน warning=FALSE, message=FALSE
- ตั้งค่าทั้งไฟล์ execute: ใน YAML หรือ knitr::opts_chunk$set()
ตัวอย่าง
1 ไม่รัน โชว์แต่โค้ด #| eval: false เป็นแบบนี้
2 รัน และ โชว์โค้ด #| eval: true เป็นแบบนี้
plot(1:10)
3 โชว์โค้ด #| echo: true เป็นแบบนี้
plot(1:10)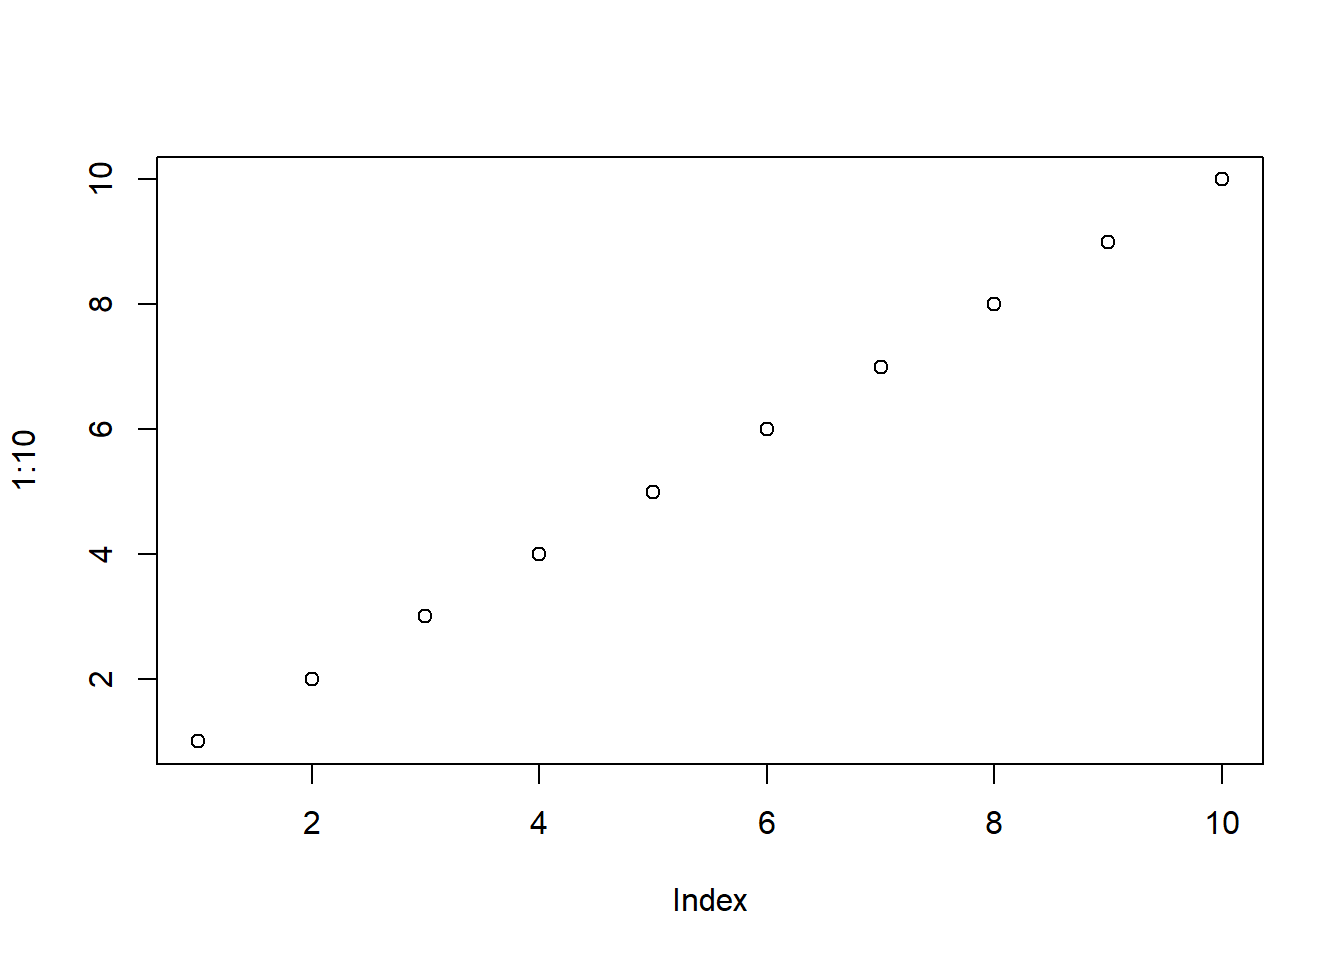
4 ไม่โชว์โค้ด #| echo: false เป็นแบบนี้

5 ไม่โชว์ผลลัพธ์ include=FALSE รันโค้ดเบื้อหลัง
จริง ๆ รัน
number <- 1:10
อยู่เบื้องหลัง
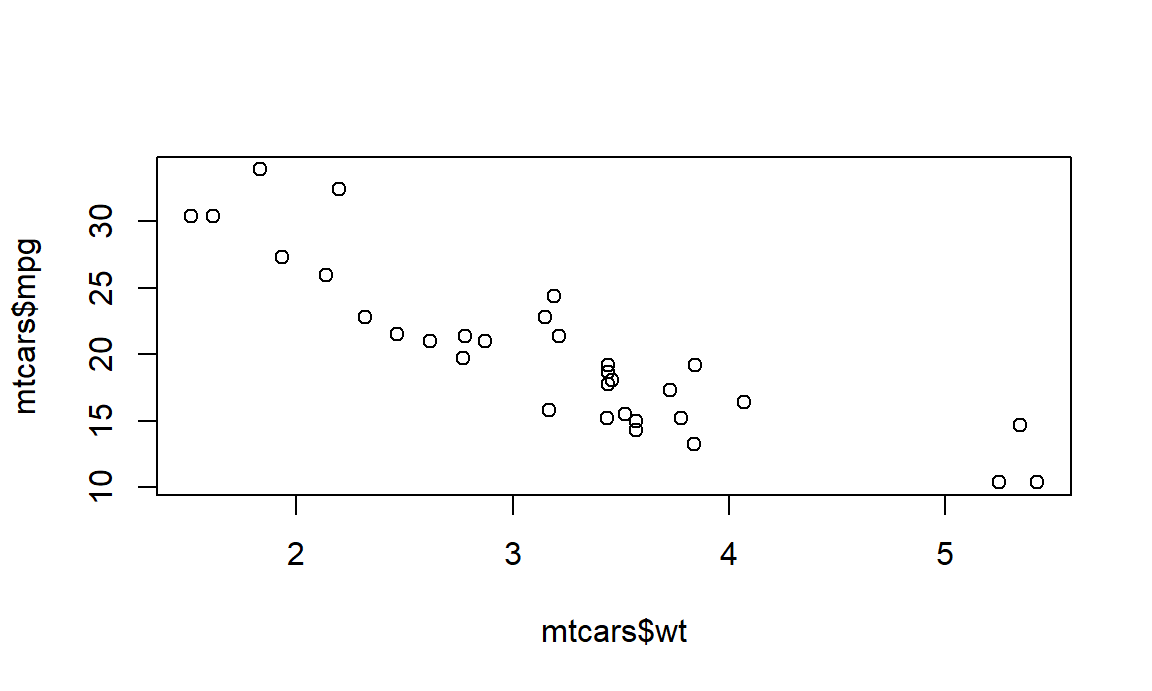
number [1] 1 2 3 4 5 6 7 8 9 106 ใส่ชื่อ chunck #| label: fig-mtcars และ ใส่ caption รูป #| fig-cap: "Scatterplot of mpg vs wt"
plot(mtcars$wt, mtcars$mpg)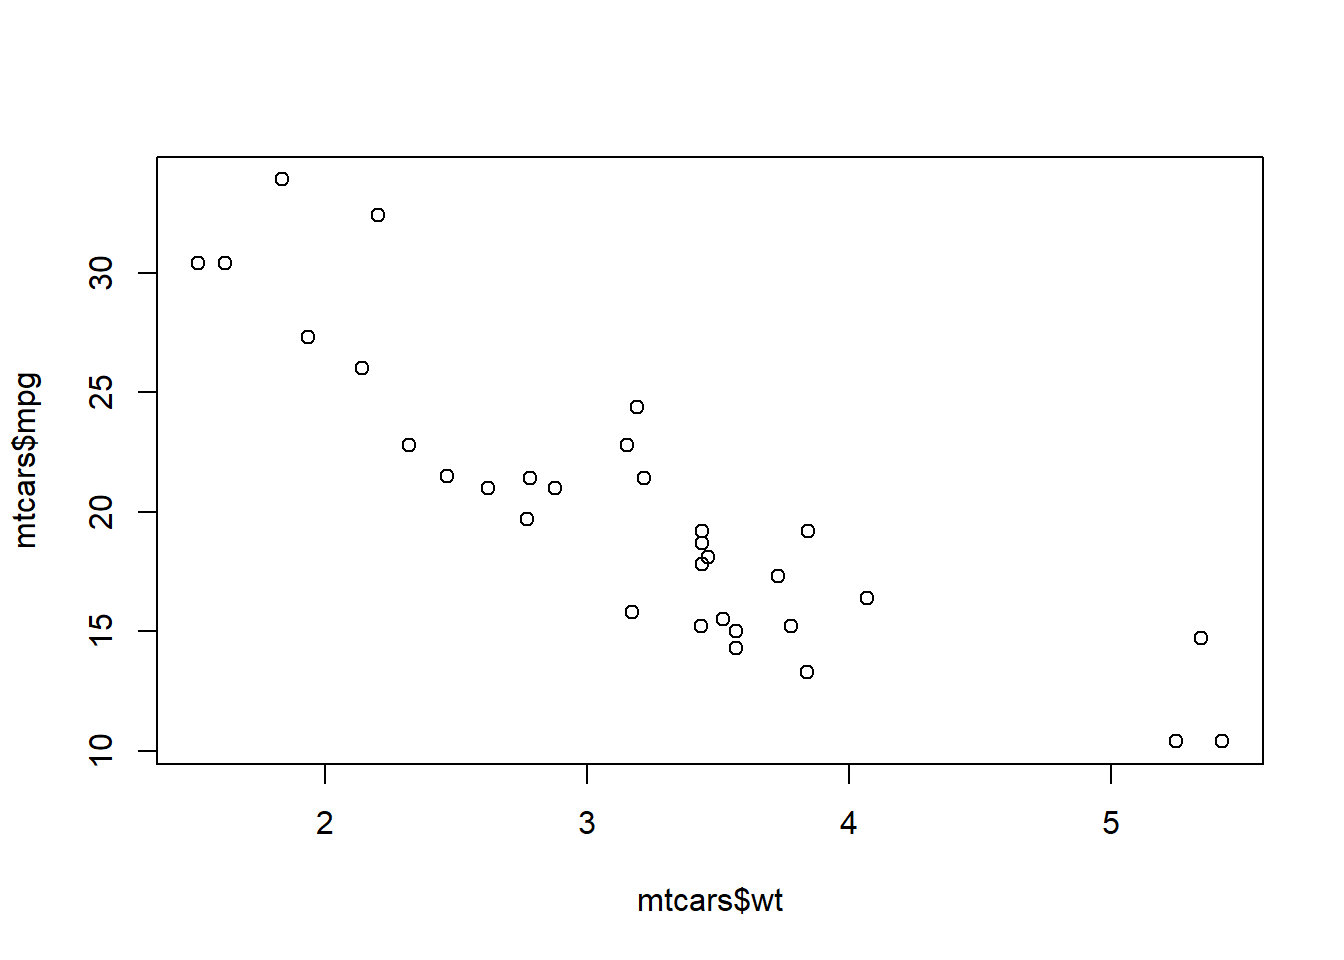
- รูป2 ใส่
#| label: fig-mtcars2วางไว้ตรงกลาง#| fig.align: "center"และ กว้าง หก นิ้ว#| fig.width: 6และ อัตราส่วน สูงต่อกว้าง#| fig.asp: 0.6และ โชว์ 50% ของรูปout.width: "50%"และ และ ใส่ caption รูป#| fig-cap: "Scatterplot of mpg vs wt"
plot(mtcars$wt, mtcars$mpg)